

Today, every online purchase, customer inquiry, financial transaction, inventory movement, website visit, and operational process generates valuable information— and how you handle that information is through the power of Data Science and Analytics.
What Is Data Science and Analytics?
Data Science and Analytics are complementary disciplines that help organizations transform raw information into meaningful insights. Data Analytics focuses on collecting, organizing, cleaning, analyzing, and visualizing data to answer business questions. Meanwhile, Data Science expands these capabilities by combining analytics with programming, statistics, machine learning, and artificial intelligence to predict future outcomes and automate analytical processes.
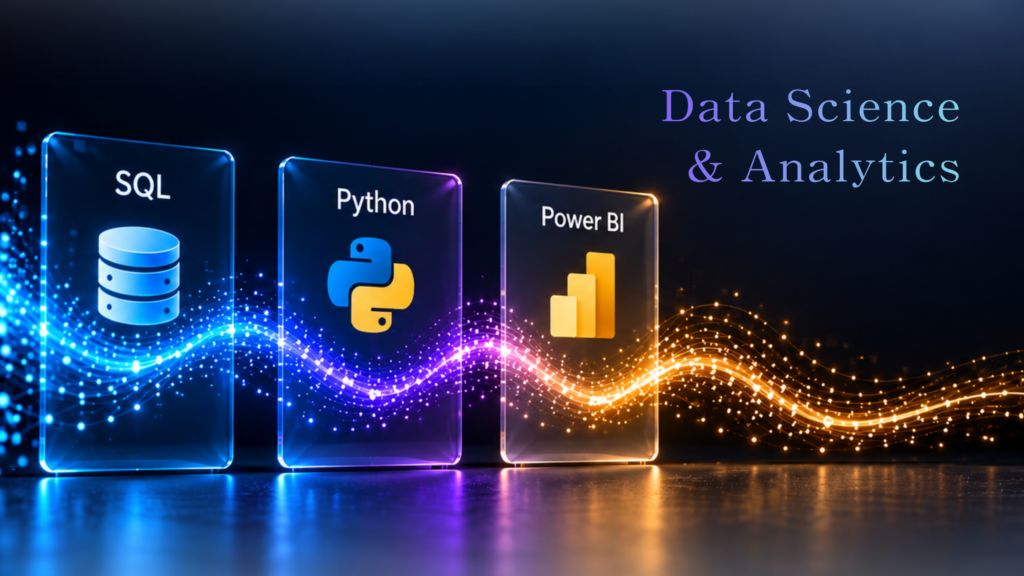
Data is extracted from databases using SQL, processed and analyzed using Python, and presented through interactive dashboards using Power BI. Together, these technologies enable organizations to transform millions of records into information that supports confident business decisions. This process of integrating digital tools has become the standard for modern analytics, because it combines efficient data management, advanced analysis, and compelling visualization into one complete solution.
How SQL, Python, and Power BI Work Together
Despite different utilization, SQL, Python, and Power BI complement one another— leading best and most valuable aspects in modern analytics for its flexibility and reliable result and output. Below, I defined the strengths of each tool that explains why the integration of it altogether produces accurate data and statistics.
SQL is the Foundation of Data Management. SQL enables professionals to retrieve, organize, validate, and manage data stored within relational databases. It provides the structured foundation required for accurate analysis.
Python is for Advanced Analytics and Automation.Python allows analysts to clean datasets, automate repetitive processes, perform statistical analysis, and build predictive models using industry-standard libraries.
Power BI Turns Insights into Decisions. Power BI transforms analytical results into interactive dashboards that executives and stakeholders can easily understand. Instead of reading lengthy reports, decision-makers can explore live dashboards that highlight key performance indicators, trends, and business opportunities.
Together, these technologies create an end-to-end analytics workflow that mirrors how modern organizations solve business problems. Hence, unlocking your journey in mastering these three tools will open plenty of doors in your career!
However, before mastery, learning analytics requires more than understanding software features. It requires meticulous attention, intense effort and perseverance, along with the need of practical experience working with realistic datasets and business scenarios.
If you are overwhelmed with where to enroll, I would say worry no more because Trainosys Training Services delivers all the qualities mentioned above. Trainosys is one of the top-performing instructor-led learning emphasizing practical workplace application in the Philippines. Every program enables professionals to develop industry-ready analytical skills regardless of their preferred learning environment.
Explore Trainosys’ Data Science and Analytics Courses
Duration: 5 Days (35 Hours)
Designed for professionals, analysts, aspiring data scientists, and business decision-makers who want to turn data into valuable business insights. Provides a structured, hands-on approach to the complete data analytics lifecycle, from defining business problems and preparing datasets to building dashboards and introducing predictive analytics using real-world data.
Key Learning Objectives:
- Understand the complete data science and analytics lifecycle, from business problem identification and data collection to insight generation and decision support.
- Prepare, clean, and transform datasets while applying exploratory data analysis (EDA) and statistical techniques to identify patterns and trends.
- Build meaningful dashboards and data visualizations that communicate insights effectively and support business storytelling.
- Develop foundational predictive analytics skills by understanding basic machine learning concepts, model evaluation, and business interpretation of analytical results.
- Complete an end-to-end analytics project that integrates data preparation, visualization, KPI development, and insight-driven recommendations using real-world datasets.
Duration: 5 Days (35 Hours)
Targeted to professionals who want to combine data analytics with SQL to extract valuable business insights from data. Teaches practical learning experience that integrates database querying, data preparation, visualization, and analytical techniques, enabling participants to solve real-world business challenges through data-driven decision-making. Equips participants to develop practical SQL skills, perform exploratory data analysis, and create interactive dashboards.
Key Learning Objectives:
- Develop advanced SQL skills to retrieve, join, analyze, and optimize data from relational databases for business reporting and analytics.
- Clean, transform, and prepare datasets using SQL techniques to improve data quality, consistency, and reliability for analysis.
- Perform exploratory data analysis to identify trends, patterns, and actionable insights that support informed business decisions.
- Create interactive dashboards and data visualizations using Power BI and Tableau to present analytical results effectively to stakeholders.
- Apply an end-to-end analytics workflow by combining SQL, business intelligence tools, and analytical techniques to solve real-world business problems and support data-driven decision-making.
Duration: 5 Days (35 Hours)
Aimed to professionals and aspiring data scientists who want to harness Python for data analysis, visualization, and machine learning. Discusses practical, hands-on learning experience that equips participants with the skills to transform raw data into meaningful insights and support data-driven decision-making across various industries. Develops participants to learn how to collect, clean, analyze, and visualize data using Python’s leading data science libraries.
Key Learning Objectives:
- Utilize Python libraries such as NumPy, Pandas, Matplotlib, and Scikit-learn to prepare, analyze, and visualize datasets effectively.
- Clean, transform, and explore structured data to identify trends, patterns, and actionable business insights using industry-standard data science techniques.
- Apply statistical methods and exploratory data analysis to support informed decision-making and solve analytical problems.
- Build and evaluate foundational machine learning models using Python to perform prediction, classification, and data-driven analysis.
- Develop end-to-end data science workflows that integrate data preparation, analysis, visualization, and model development to address real-world business and operational requirements.
Duration: 4 Days (28 Hours)
Designed for data analysts, business professionals, and decision-makers who want to elevate their business intelligence skills using Microsoft Power BI. Focuses on transforming complex datasets into interactive dashboards and meaningful visualizations that support strategic and operational decision-making. Combines applied analytics techniques with advanced dashboard development to help participants create impactful, enterprise-ready reporting solutions.
Key Learning Objectives:
- Prepare, transform, and model data from multiple sources using Power Query and advanced data modeling techniques to create reliable datasets for analytics.
- Build interactive dashboards using advanced visualizations, drill-through pages, custom visuals, bookmarks, and data storytelling techniques to present business insights effectively.
- Develop advanced DAX measures, calculated columns, and time intelligence calculations to perform comprehensive business analysis and reporting.
- Optimize Power BI solutions by applying performance tuning, security features, report automation, and best practices for enterprise dashboard development.
- Apply end-to-end data analytics workflows by integrating data preparation, visualization, advanced dashboarding, and business intelligence techniques to solve real-world business challenges.
Data Science Integration with SQL Server, Python, and Power BI
Duration: 5 Days (35 Hours)
Designed for professionals who want to build end-to-end data analytics and business intelligence solutions using three of the industry’s most widely used technologies. Demonstrates how SQL Server, Python, and Microsoft Power BI work together to collect, process, analyze, and visualize data, enabling organizations to make faster and more informed decisions.
Key Learning Objectives:
- Design integrated data workflows by connecting SQL Server, Python, and Power BI to support efficient data management, analytics, and reporting.
- Extract, clean, transform, and manage structured data using SQL Server and Python to prepare high-quality datasets for business analysis.
- Apply Python libraries for data analysis, statistical exploration, automation, and predictive modeling to uncover meaningful business insights.
- Develop interactive dashboards and executive reports in Power BI by integrating SQL Server data and Python-generated analytical outputs.
- Build complete end-to-end analytics solutions by combining database management, data science techniques, and business intelligence best practices to support data-driven decision-making.
Data Visualization: Mastering Data Visualization – Theory & Foundations
Duration: 3 Days (21 Hours)
Aimed to data analysts, business professionals, managers, and decision-makers who want to communicate data with clarity and impact. Focuses on the principles, psychology, and best practices of data visualization, enabling participants to transform complex information into meaningful visual stories that support better business decisions. Teaches universal visualization concepts that can be applied across Microsoft Excel, Power BI, Tableau, Python, R, Google Looker Studio, and other business intelligence tools.
Key Learning Objectives:
- Understand the core theories, principles, and psychology of data visualization to create clear, accurate, and impactful visual communications.
- Select the most appropriate chart types and visualization techniques based on data characteristics, business objectives, and audience needs.
- Apply visual design principles, color theory, accessibility guidelines, and ethical visualization practices to produce professional reports and dashboards.
- Develop effective data storytelling skills by organizing insights into compelling narratives that support executive reporting and business decision-making.
- Design business dashboards and visual reports by applying industry best practices, avoiding common visualization errors, and creating actionable insights across multiple analytics platforms.
Data has become one of the most valuable assets in every modern organization, but it is only those who understand SQL, Python, Power BI, and Data Science who are helping organizations solve complex business challenges, improve operational performance, and make faster, evidence-based decisions.
Through Trainosys Training Services, expert instructors, practical learning, and industry-relevant course content, course participants are continuously equipped with the knowledge and confidence needed to thrive in today’s data-driven economy. At the same time, Trainosys’ course participants are taught how to handle business tasks in more efficient and effective ways, becoming productive and ahead in respective workplaces.
Become a data expert now via [email protected]
For more IT and professional development programs, visit our website at www.trainosys.com